
Agent-led research / Case study
From research question to Forest Time Machine.
An experiment in agent-led, end-to-end research. Following the work from a scientific question through real datasets, reproducible experiments, and a public research interface.
A research question became an executable investigation
Canopy Monitor is an Innolabs experiment in agent-led research, using Romania’s forests as a concrete scientific setting.
The initial brief asked agents to investigate how Google’s new Forest Typology maps could support research in Romania, propose exploratory use cases, and implement them independently. It also required explicit completion gates. The task combined scientific reading, source acquisition, geospatial programming, experimentation, and interpretation.
ForTy itself is the work of Maxim Neumann and colleagues at Google DeepMind, Google Research, the World Resources Institute, and the International Institute for Applied Systems Analysis. Innolabs’ contribution is the agent-led investigation and its research interface. We used the published datasets; we did not train the underlying forest model. The original announcement and research paper describe that upstream work.
Under human direction, agents carried the investigation through working code, real-data experiments, reproducibility checks, and qualified findings. Subsequent requests developed the work into Forest Time Machine and a separate forest-balance study. The research process crossed several conversations, with human choices about scope, presentation, and publication.
The workflow connected decisions to artifacts
How the investigation moved from question to public evidence

Read the workflow as text
- Frame the question: define the Romanian research brief and stopping gates.
- Investigate sources: inspect documentation and freeze versions in a source manifest.
- Run experiments: produce maps and tables through independent Atlas, Conservation, Change, and Reliability analyses.
- Verify and revise: check calculations, source hashes, and cached reruns; revise methods and rerun experiments when needed.
- Build the research interface: prepare a validated website bundle from scientific outputs.
- Publish: make the site and its evidence available for inspection.
Each stage left an artifact the next stage could inspect. A source manifest fixed the inputs; analysis commands produced tables and maps; verification records documented checks. The website consumed prepared results. Human framing and follow-up questions shaped the progression, including the later expansion beyond the original pilots.
Investigating the data changed the methods
Source discovery involved more than collecting download links. Agents inspected product documentation, raster bands, coordinate systems, missing values, geographic coverage, and reference dates. Those details determined which comparisons were defensible.
The published 2020 ForTy v1 baseline and the experimental annual v2 beta series are distinct products. The national atlas used v1; temporal analysis stayed within the annual beta series. Comparing v1 directly with a later beta map could confuse a product change with a landscape change. The dataset documentation also explains why model scores require care: they have not been calibrated as local probabilities.
Reference evidence included Romanian county boundaries, the national virgin-forest catalog, Natura 2000 boundaries, expert validation samples, and Hansen tree-cover loss. These sources describe different things and carry different dates. An inventory overlap can support reconciliation; it cannot establish that a map label is correct or that an area has a particular legal status.
The resulting acquisition layer recorded versions, public URLs, checksums, and parameters. Downloads entered a shared cache, while each experiment read its own source inputs. Freezing those choices made a repeated run interpretable: the same code had to see the same evidence.
Even the class definitions needed interpretation. Forest type involves management history and intent, which satellites observe indirectly. A high primary-forest score is a model output requiring review. The annual beta product also distinguishes mature and regrowing primary forest; the implementation preserved that distinction. Reducing every green pixel to a single forest category would have erased information the research question needed.
Four experiments turned the brief into answerable questions
A national atlas established the baseline
The atlas mapped the 2020 classes across Romania’s 42 county units and exported a class raster, county statistics, and charts. About 8.08 million hectares received one of the four forest labels. That figure describes model-mapped area under the study’s definitions and boundaries. It is not an official forest inventory or an unbiased estimate of true forest extent.
Conservation screening tested a practical question
Within four fixed pilot windows, the conservation experiment searched for primary-class candidates outside both supplied inventories. At a model-score threshold of 0.7 and minimum patch size of 0.5 hectares, it retained zero qualifying patches. This bounded negative finding answered the chosen screen. It does not show that Romania lacks unrecorded primary forest, or that areas outside those inventories lack protection.
Annual change became a screening queue
The temporal experiment examined the beta series from 2017–2025. It required a qualifying departure from the 2020 natural-forest classes to persist in the same destination class for two adjacent years. Across the original pilots, the pixel screen identified 206.94 hectares of persistent candidates. Polygon exports applied a separate minimum-area filter. Comparison with Hansen loss supplied additional disturbance evidence, while causes and permanent land-use conversion remained unverified.
The reliability audit exposed a reference gap
The available global validation dataset contained 21 sites inside Romania, with 18 resolved examples. Those examples covered only three classes, leaving primary forest, plantation forest, and tree crops unrepresented. The resulting confusion counts were descriptive. They could not support national six-class accuracy claims or threshold calibration. Recognizing that limit was a substantive research result.
These findings refer to the original national atlas and four pilot windows, rather than the explorer’s later expanded rectangles or the whole-massif study. The downloadable research record preserves the underlying summaries and verification records.
Completion depended on evidence gates
The research goal defined five gates: verified data, correctness checks, independent execution on real inputs, cached numerical reproducibility, and evidence-qualified conclusions. A successful process could end with a negative result or insufficient evidence. Completion did not require a positive scientific claim.
Focused tests covered class decoding, missing values, invalid scores, area calculations, tile ownership, and temporal persistence. Equal-area grids made hectares accountable. Checks prevented overlapping source tiles from counting a cell twice, while county statistics had to reconcile with national totals. These protections mattered because plausible maps can conceal numerical mistakes.
The recorded completion check verified 388 source-file checksums and confirmed matching numerical results between each experiment’s latest two completed runs. The report also passed checks for offline resources and existing artifact links. Its rebuild reproduced byte for byte. These records support a claim about reproducible execution with pinned inputs; they do not establish ecological accuracy.
The independent commands provided a practical check on the research structure. Each could run from original inputs without borrowing another experiment’s conclusions. Shared code handled acquisition and spatial accounting, while the questions remained separately executable. That arrangement made it possible to rerun one analysis, inspect its provenance, or challenge its assumptions without reconstructing the entire project.
This distinction applies equally to agent evaluation. Passing software checks demonstrates particular tested behaviors. Agreement between satellite products adds evidence, but shared limitations and differing definitions still constrain interpretation. Scientific review remains necessary after the program finishes successfully.
Publishing made the evidence inspectable
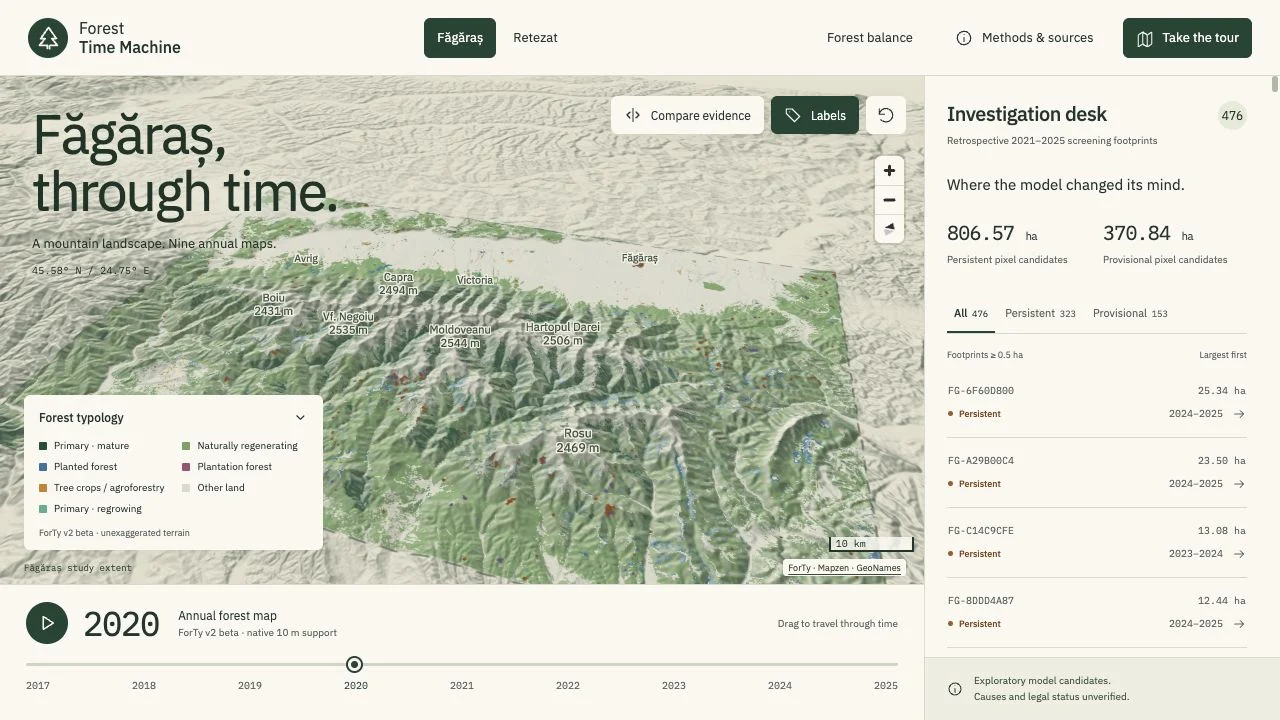
The next human request asked for a visual application around the completed research. Agents built a terrain-based explorer, initially around the Făgăraș pilot and later expanded to Făgăraș and Retezat. Visitors can select nine annual maps, inspect candidate footprints and class histories, and compare them with Hansen disturbance evidence. Methods and interpretation limits remain available alongside the map.
The public site presents precomputed scientific outputs. Python owns the calculations; the browser presents a validated static bundle. That boundary keeps the published experience tied to the prepared evidence. The site is a research artifact, with no agent conducting a fresh investigation when someone moves the timeline.
A subsequent question asked how much forest and canopy the two mountains had lost and gained. It required a separate whole-massif study using published relief polygons. Those polygons differ from both the pilot windows and the explorer’s rectangles. The study kept ForTy forest classifications, Hansen disturbance, and Copernicus canopy measurements separate, including their different periods and spatial support.
The published balance report makes those distinctions visible through methods, maps, sensitivity results, and downloads. Readers can examine why sources differ instead of being handed a single combined total that obscures their meaning.
For the forest balance, both endpoints used one common valid-pixel mask. Gained area minus lost area had to equal the change in mapped forest area. Intermediate annual observations could reveal recovery hidden by the endpoints. These accounting identities gave the follow-up investigation concrete checks before its findings reached the public report.
The case study is about continuity and accountability
Canopy Monitor shows agents connecting several stages of one research project: interpreting a brief, investigating sources, implementing methods, running experiments, checking outputs, and building a public presentation. The artifacts between stages made that continuity inspectable. Explicit stopping gates gave the work a concrete completion condition.
Human direction remained part of the process. People chose the setting, approved scope, requested follow-up studies, supplied account access where needed, and directed publication. No field verification, causal attribution, or legal compliance assessment was performed. The project does not measure agent productivity against a human baseline, and one completed case cannot establish general research reliability.
The useful next question is how consistently this process holds across other datasets and research tasks. Here, the strongest evidence is the completed chain of artifacts, including its negative findings and stated limits. Explore Forest Time Machine to inspect the public result.