
Demonstrator / Lab journal
ATHENA TRL-4 Demonstrator: Explainable Athlete Monitoring Dashboards
ATHENA TRL-4 demo app: explainable handball load, recovery & deviation dashboards using synthetic data.
We built ATHENA TRL-4, a demo application that showcases how athlete monitoring data can be integrated, aggregated, and explained for a male handball team.
This is a TRL-4 demonstrator: all data used is synthetic in nature (deterministic, logically coherent), created specifically for showcasing functionality, explainability, and scenario-driven demos - not for real-world deployment yet.
You can check our demo here
What the demo showcases
ATHENA demonstrates baseline-driven deviation analysis and transparent attribution across multiple data domains.
Indicator groups (as implemented in the demo)
1) Cardiovascular & Internal Load
- Session duration, Avg/Max HR, HR zones (Z1–Z5)
- TRIMP, Session RPE, Calories (estimated)
- HR reserve usage, HR recovery 1’, cardiac drift, intensity density (Z4+Z5 share)
2) Recovery, Readiness & Autonomic Balance
- HRV (RMSSD), Resting HR
- Sleep duration, efficiency, debt, fragmentation
- HRV trend slope, autonomic balance flag
- Readiness Score (0–100) (explainable composite from HRV drop, RHR increase, sleep debt)
3) Mechanical Load & Locomotion (IMU)
- PlayerLoad, jumps, impacts
- accel/decel counts, peak acceleration
- mechanical density, asymmetry index
4) Handball-Specific Throwing Load
- throw count, throw density
- max arm angular velocity, intensity zones
- high-velocity throws, throw fatigue index
- Throw Load Index (weighted composite)
5) Metabolic & Physiological Stress (optional in demo)
- SpO₂, respiratory rate
- skin temperature deviation, ventilatory stress, thermal strain
6) Subjective & Psychometric (optional toggle in demo)
- DOMS, perceived recovery, mental stress, subjective sleep quality
7) Data Quality & Trust
- signal quality score, missingness ratio
- plausibility flag, device/source label
Composite indices (explainable, not predictive)
-
Fatigue Index (0–100)
combines HRV drop %, RHR increase, TRIMP deviation %, mechanical deviation %
-
Overall Risk Score (0–100)
weighted view of recovery deficit + load spike + mechanical/throw spike
(all components expose contributing indicators; no diagnosis/prediction)
Included dashboards (demo pages)
- Training Load & Deviation Dashboard (baseline → Δ% deviations → explainable drivers)
- In-Match Sensor Dashboard (seeded live simulation with alerts + “Why” explanations)
- Recovery & Regeneration Dashboard (overnight recovery using device-derived metrics)
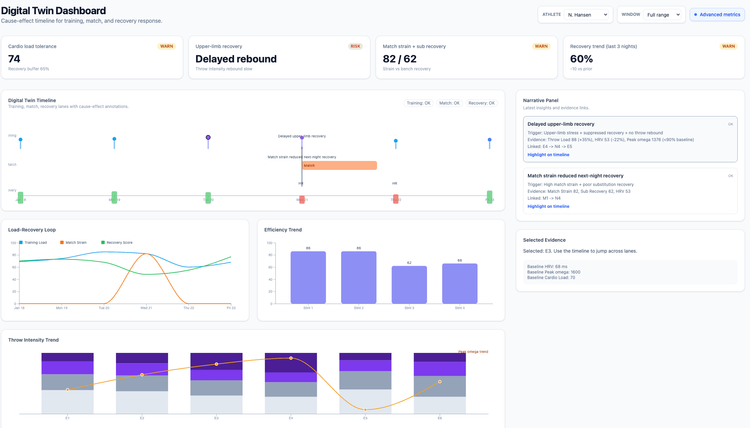
- Individual Athlete Digital Twin (timeline + rule-based cause→effect annotations)
A key TRL-4 visual is the D3 Sunburst attribution:
“Where does overload come from?”
Total overload → Episode → Athlete → Driver (Cardio / Mechanical / Throw / Recovery deficit)